| ➡️ Click here to Join Whatsapp News Group - Get instant updates of all Banking News |
India Export Import Data: The Reserve Bank of India (RBI) has released the latest data on India’s international trade in services for April 2026. According to the data, India’s services exports, also known as receipts, stood at US$ 37.02 billion in April 2026, showing a growth of 12.7% compared to the same month last year. During the same period, services imports, or payments, were recorded at US$ 18.42 billion, registering an annual growth of 8.9%. The RBI said that the figures for January to April 2026 are provisional and may be revised later based on balance of payments statistics. The data highlights the continued strong performance of India’s services sector, with exports remaining significantly higher than imports during the month.
| International Trade in Services | ||
| (US$ million) | ||
| Month | Receipts (Exports) | Payments (Imports) |
| January – 2026 | 38,165 | 16,631 |
| February – 2026 | 34,708 | 16,865 |
| March – 2026 | 38,208 | 17,210 |
| April – 2026 | 37,021 | 18,417 |
This is a positive report for India. The most important point is not just that exports increased, but that India earned US$ 18.6 billion more than it spent on services during April 2026. A strong services surplus is one of the biggest strengths of the Indian economy and helps support economic growth, foreign exchange reserves, and the balance of payments.
India’s services sector continues to be a major strength for the economy. Despite global uncertainties, services exports grew by 12.7% in April 2026 and remained nearly double the value of imports, generating a healthy surplus of about US$ 18.6 billion.
India exported about US$37 billion worth of services in April 2026 while importing only about US$18 billion, creating a surplus of around US$18.6 billion. That surplus:
- Brings dollars into India
- Supports forex reserves
- Helps offset India’s large oil import bill
- Reduces pressure on the current account deficit
- Supports the rupee
How India Compares with Other countries?
India vs United States
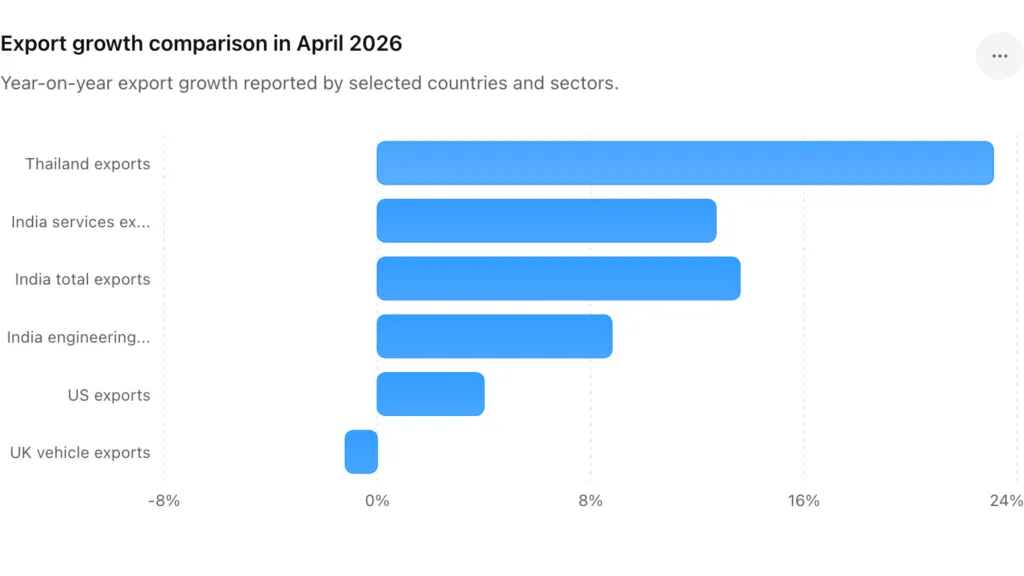
India’s services exports grew by 12.7%, while U.S. exports increased around 4% in April 2026. India’s growth rate is much higher, although the overall size of the U.S. economy and exports remains far larger.
India vs United Kingdom
The UK faced export-related weakness in some sectors. Vehicle production and exports were under pressure due to global trade challenges and weaker demand from China. India’s services sector is currently showing stronger momentum than several traditional economies.
India vs Thailand
Thailand reported a very strong 23.1% export growth in April 2026, driven by electronics and automobile demand. Thailand’s growth rate was higher than India’s, but Thailand’s export base is much smaller and is heavily dependent on manufacturing exports.
India’s Biggest Strength: Services Surplus
The most important difference is not just export growth but the trade surplus.
| Country/Area | Position |
|---|---|
| India Services Trade | Large Surplus |
| Many Advanced Economies | Often Deficit or Smaller Surplus |
| UK Trade with India | Services Deficit with India |
| US Overall Trade | Large Trade Deficit |
The UK actually runs a services trade deficit with India, showing how competitive Indian IT and business services have become.