
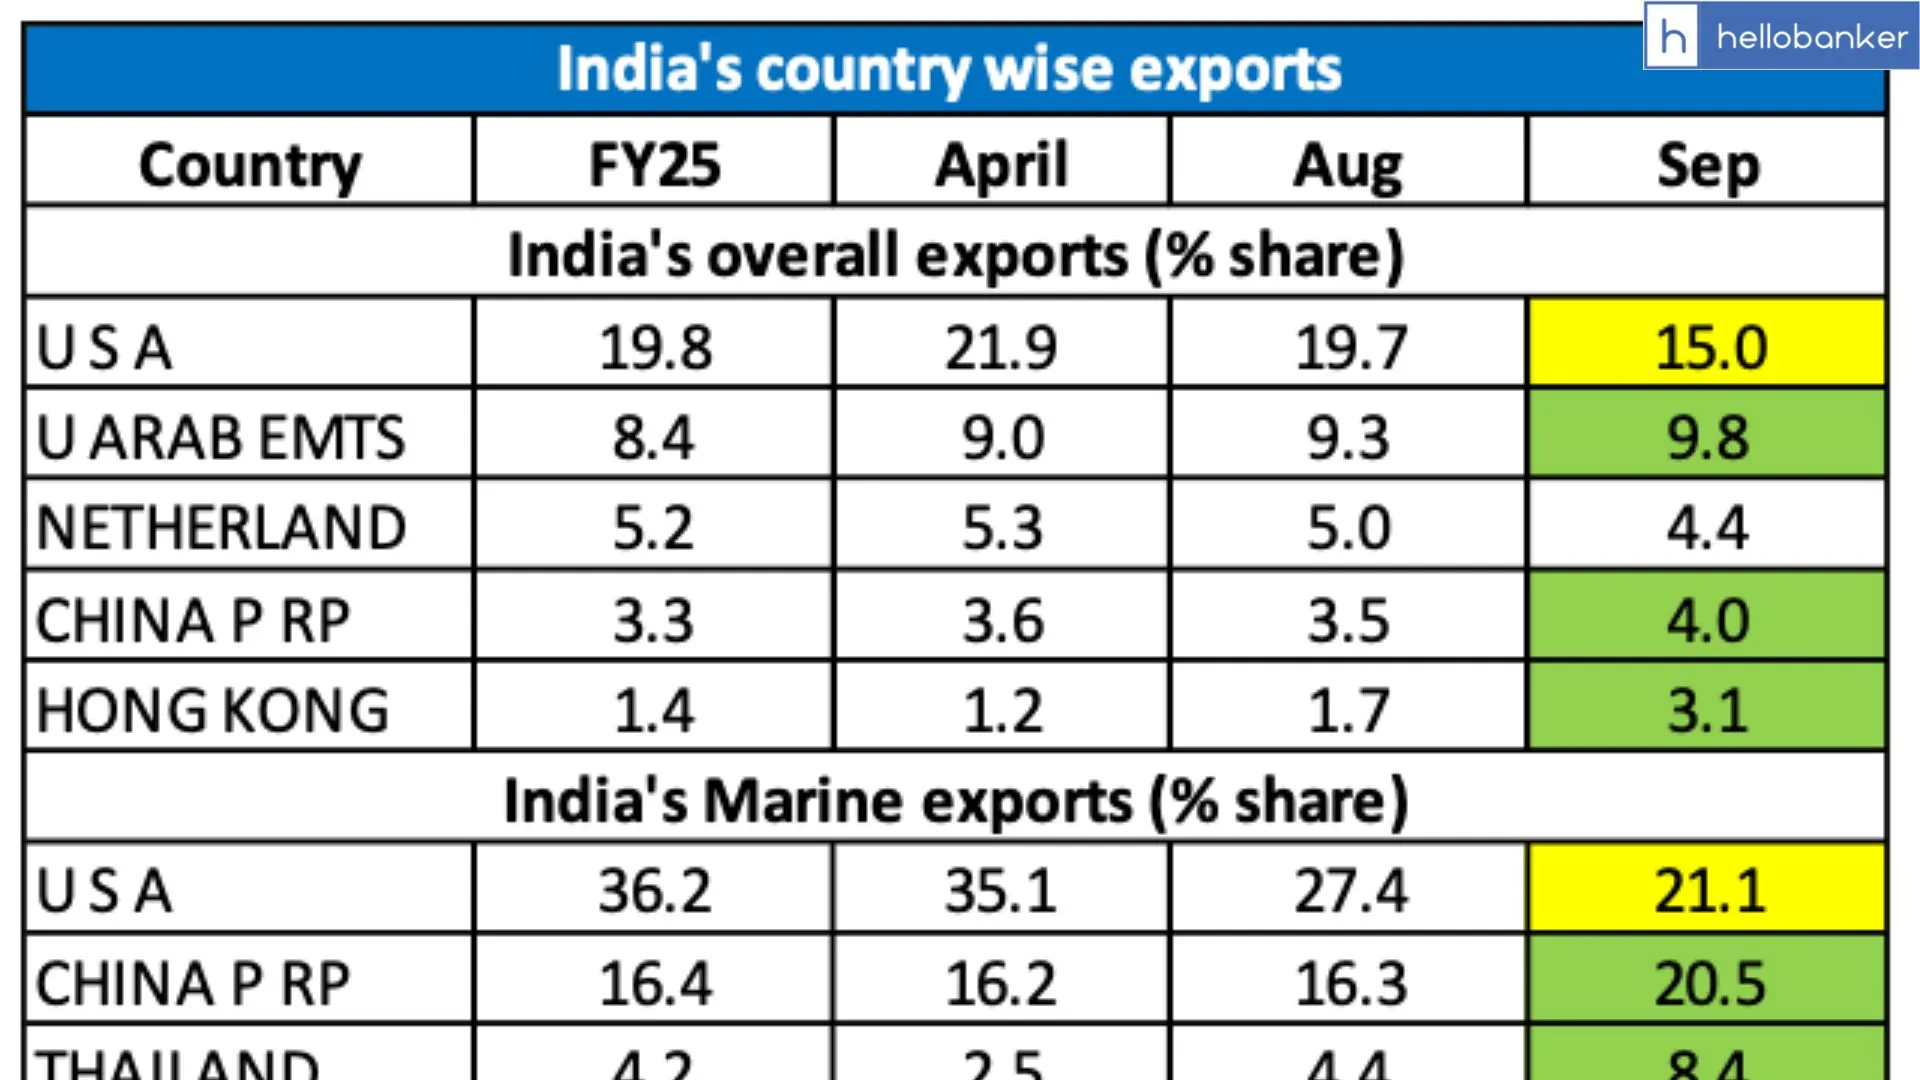
As per SBI Report, India’s total exports for FY26 (April–September 2025) rose by 2.9% to $220 billion, compared to $214 billion during the same period in the previous financial year. Exports to the United States also saw growth of 13%, increasing from $40 billion in Apr–Sep FY25 to $45 billion in Apr–Sep FY26. However, the monthly data for September shows a different trend, with exports to the US recording a 12% year-on-year decline. Since July 2025, the US share in India’s total exports has been gradually decreasing. By September 2025, the US accounted for 15% of India’s exports.
Sector-wise Export Performance
Exports to the US have fallen in several key sectors:
- Marine products: share down to 15% in Sep’25 from 20% in FY25
- Precious and semi-precious stones: share down to 6% in Sep’25 from 37% in FY25
- RMG cotton garments: share down to 29% in Sep’25 from 34% in FY25
- Cotton fabrics and made-ups: share down to 31% in Sep’25 from 39% in FY25
Despite the declining US share, marine products and RMG cotton still registered overall positive growth during Apr–Sep FY26.
Export Diversification to Other Countries
India’s export share to other destinations has increased, showing a clear trend of diversification.
Among the top export partners:
- UAE, China, and Hong Kong gained a higher share in India’s overall exports.
- For marine products, exports to China, Thailand, Vietnam, and Japan increased.
- For RMG cotton, India exported more to the UAE.
- For cotton fabrics and made-ups, the share of Bangladesh, Sri Lanka, and Nigeria increased.
- For precious and semi-precious stones, exports to UAE and Hong Kong rose.
| India’s overall exports(% share) | ||||
| USA | 19.8 | 21.9 | 19.7 | 15.0 |
| UARAB EMTS | 8.4 | 9.0 | 9.3 | 9.8 |
| NETHERLAND | 5.2 | 5.3 | 5.0 | 4.4 |
| CHINA P RP | 3.3 | 3.6 | 3.5 | 4.0 |
| HONG KONG | 1.4 | 1.2 | 1.7 | 3.1 |
| India’s Marine exports(% share) | ||||
| USA | 36.2 | 35.1 | 27.4 | 21.1 |
| CHINA P RP | 16.4 | 16.2 | 16.3 | 20.5 |
| THAILAND | 4.2 | 2.5 | 4.4 | 8.4 |
| VIETNAM | 5.2 | 6.7 | 7.3 | 7.3 |
| JAPAN | 5.5 | 4.5 | 6.2 | 6.4 |
| India’s Precious, semi precious stones exports (% share) | ||||
| HONG KONG | 23.6 | 24.9 | 22.7 | 49.7 |
| UARAB EMTS | 13.3 | 16.5 | 18.2 | 17.7 |
| BELGIUM | 9.8 | 10.0 | 4.1 | 7.7 |
| USA | 36.7 | 34.5 | 10.1 | 6.1 |
| THAILAND | 3.0 | 2.2 | 1.8 | 5.5 |
| India’s RMG Cotton exports(% share) | ||||
| USA | 33.9 | 34.2 | 35.8 | 29.0 |
| UARAB EMTS | 6.4 | 6.0 | 7.7 | 10.2 |
| UK | 9.6 | 9.9 | 8.9 | 9.2 |
| NETHERLAND | 5.5 | 5.2 | 5.0 | 5.1 |
| GERMANY | 5.5 | 5.3 | 5.1 | 4.8 |
| India’s Cotton Fabrics, Made-ups exports(% share) | ||||
| USA | 39.0 | 37.3 | 38.8 | 30.8 |
| BANGLADESH | 7.5 | 8.1 | 6.8 | 8.4 |
| SRI LANKA | 5.3 | 4.3 | 5.3 | 6.1 |
| NIGERIA | 2.1 | 2.3 | 2.8 | 4.1 |
| UK | 3.4 | 3.5 | 3.2 | 3.6 |
| Source: Ministry of Commerce & Industry | ||||
-

-

-

-
-

-

-

-

-
![RBI released Bulletin December 2025 [Download PDF]](https://hellobanker.in/wp-content/uploads/2025/12/Orange-and-White-Geometric-Food-Vlogger-YouTube-Channel-Art-1-390x220.webp)
-

-
-
![Deposit and Credit Data of Scheduled Commercial Banks [PDF]](https://hellobanker.in/wp-content/uploads/2025/12/Deposit-and-Credit-Data-of-Scheduled-Commercial-Banks-PDF-390x220.webp)
