Data
SBI Last 10 Years Balance Sheet, NET Profit, Branches, All Details

Connect with Us
Let’s have a look at the last 10 years balance sheet and Net Profit of India’s Largest Public Sector Bank – State Bank of India (SBI). We will also have a look at the profit generated per employee.
SBI Last 10 years NET Profit
| Year | Net Profit (Rs.crore) |
|---|---|
| 2015-16 | 9951 |
| 2016-17 | 10484 |
| 2017-18 | -6547 |
| 2018-19 | 862 |
| 2019-20 | 14488 |
| 2020-21 | 20410 |
| 2021-22 | 31676 |
| 2022-23 | 50232 |
| 2023-24 | 61077 |
| 2024-25 | 70901 |
SBI Profit Per Employee
| Year | Profit Per Employee |
|---|---|
| 2015-16 | 470 |
| 2016-17 | 511 |
| 2017-18 | -243 |
| 2018-19 | 33 |
| 2019-20 | 578.98 |
| 2020-21 | 828.35 |
| 2021-22 | 1292.72 |
| 2022-23 | 2122.64 |
| 2023-24 | 2620.46 |
| 2024-25 | 2991 |
SBI Number of Domestic Branches
| Year | No. of Domestic Branches | No. of Foreign Branches |
|---|---|---|
| 2015-16 | 16784 | 198 |
| 2016-17 | 17170 | 195 |
| 2017-18 | 22414 | 206 |
| 2018-19 | 22010 | 208 |
| 2019-20 | 22141 | 233 |
| 2020-21 | 22219 | 229 |
| 2021-22 | 22266 | 227 |
| 2022-23 | 22405 | 235 |
| 2023-24 | 22542 | 241 |
| 2024-25 | 22937 | 244 |
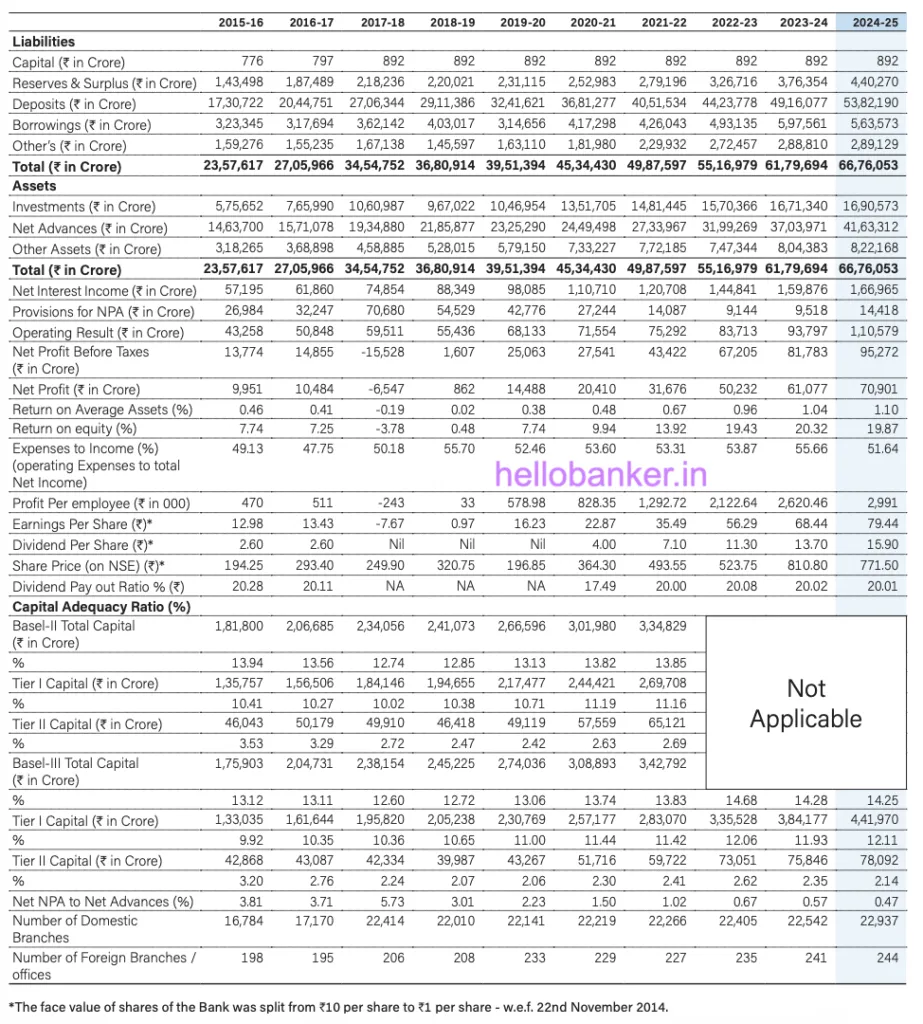
SBI Balance Sheet

Advertisement
