![Performance of Private Corporate Business Sector during Q4 2024-25 [RBI Data]](https://hellobanker.in/wp-content/uploads/2025/06/Performance-of-Private-Corporate-Business-Sector-during-Q4-2024-25-RBI-Data-780x470.webp)
Connect with Us
The Reserve Bank of India has released data on the performance of the private corporate sector during the fourth quarter of 2024-25, drawn from abridged quarterly financial results of 2,936 listed non-government non-financial companies.
Highlights
Sales
- Sales of listed private non-financial companies registered 7.1 per cent growth (y-o-y) during Q4:2024-25 as compared to 8.0 per cent growth in the previous quarter (6.9 per cent in Q4:2023-24) (Table 1A).
- Aggregate sales growth (y-o-y) of 1,659 listed private manufacturing companies moderated to 6.6 per cent during Q4:2024-25 from 7.7 per cent during the previous quarter; even as major industries such as electrical machinery, chemicals, food products and pharmaceuticals industries recorded double digit sales growth; weak performance of petroleum industry pulled down the sector’s sales growth.

- On annual basis, sales growth (y-o-y) of IT companies improved further to 8.6 per cent in Q4 from 6.8 per cent in the previous quarter and 3.1 per cent a year ago.
- Sales of non-IT services companies continued to grow in double digits at 10.9 per cent in Q4, on the back of good performance of telecommunication and transport & storage companies.
Expenditure
- Manufacturing companies’ expenses on raw material rose by 8.3 per cent (y-o-y) in tandem with their sales growth, however, raw material to sales ratio broadly remained stable during Q4 from the previous quarter (Table 2A and 2B).
- Staff cost of manufacturing, IT and non-IT services companies rose by 10.0 per cent, 6.4 per cent and 9.5 per cent, respectively, during Q4:2024-25. Staff cost to sales ratio for manufacturing, IT and non-IT services companies broadly remained stable at 5.5 per cent, 48.0 per cent, and 10.1 per cent, respectively, during Q4:2024-25.
Pricing power
Advertisement
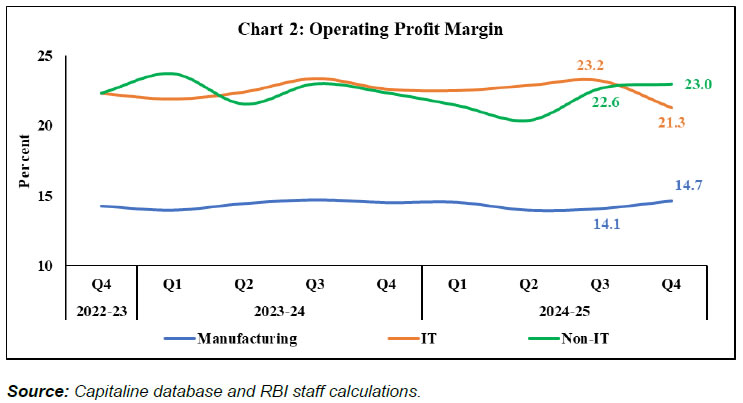
- Operating profit of manufacturing and non-IT services companies rose by 8.1 per cent and 18.4 per cent, respectively, during Q4, while it increased modestly by 2.4 per cent for IT companies (Table 2A).
- Operating profit margin improved for manufacturing and non-IT services companies sequentially to 14.7 per cent and 23.0 per cent, respectively, during Q4, while it moderated for IT companies by 190 bps to 21.3 per cent in Q4 from the previous quarter.
Interest expenses
- With sequential rise in profits, manufacturing companies’ interest coverage ratio (ICR)1 improved to 8.7 in Q4:2024-25 from 7.6 in the previous quarter. ICR for non-IT services companies remained steady and continued to stay above unity, while it improved for IT service companies during Q4 (Table 2B).
Advertisement