Connect with Us
The Bank of England has released Capital Issuance for the month of April 2025. The capital issuance statistics consist of non-government primary market issuance of bonds, commercial paper and equity, representing finance raised by UK resident entities.
Terminology
- PNFC = Private non-financial corporations
- MFI = Monetary financial institutions
- OFC = Other financial corporations
- “Other sectors” contains public corporations and non-profit institutions serving households
- CP = Commercial paper
Key points
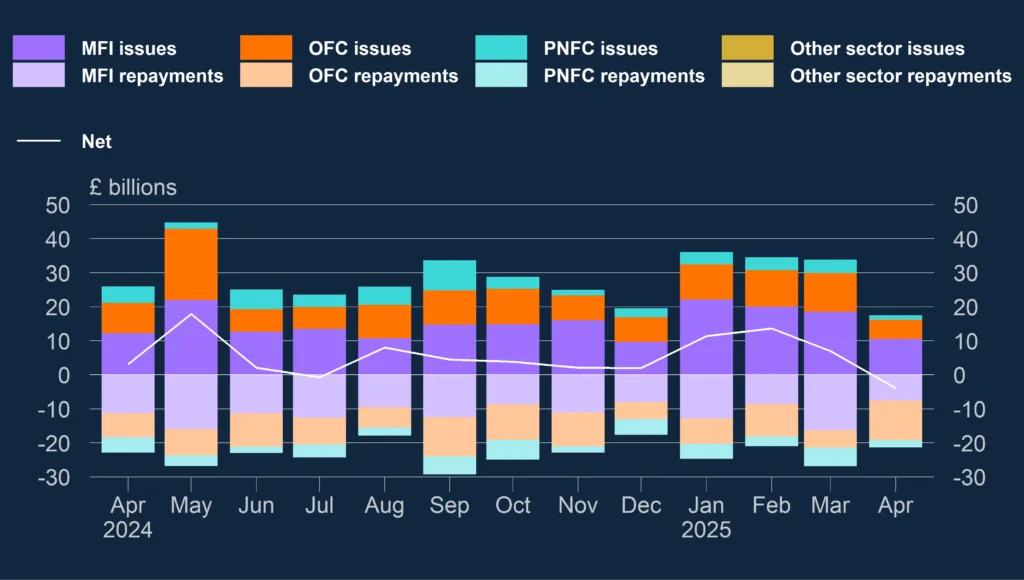
- Gross capital issuance by UK residents was £55.6 billion in April, compared to £63.2 billion in March and the previous six-month average of £59.4 billion (Chart 1).
- Net issuance was -£0.6 billion in April, compared to £1.7 billion in March and the previous six-month average of £2.3 billion (Chart 1).
- The fall in gross issuance was more than accounted for by a decrease in bond issuance of £16.4 billion, this was partially offset by a £8.6 billion increase in commercial paper issuance.
All sectors
- Gross capital issuance by UK residents was £55.6 billion in April, compared to £63.2 billion in March and the previous six-month average of £59.4 billion (Chart 1).
- Net issuance was -£0.6 billion in April, compared to £1.7 billion in March and the previous six-month average of £2.3 billion (Chart 1).
- Year to date gross issuance was £265.1 billion, £15.8 billion higher than at the same point the previous year (Chart 2) and £66.1 billion higher than the previous four-year average.
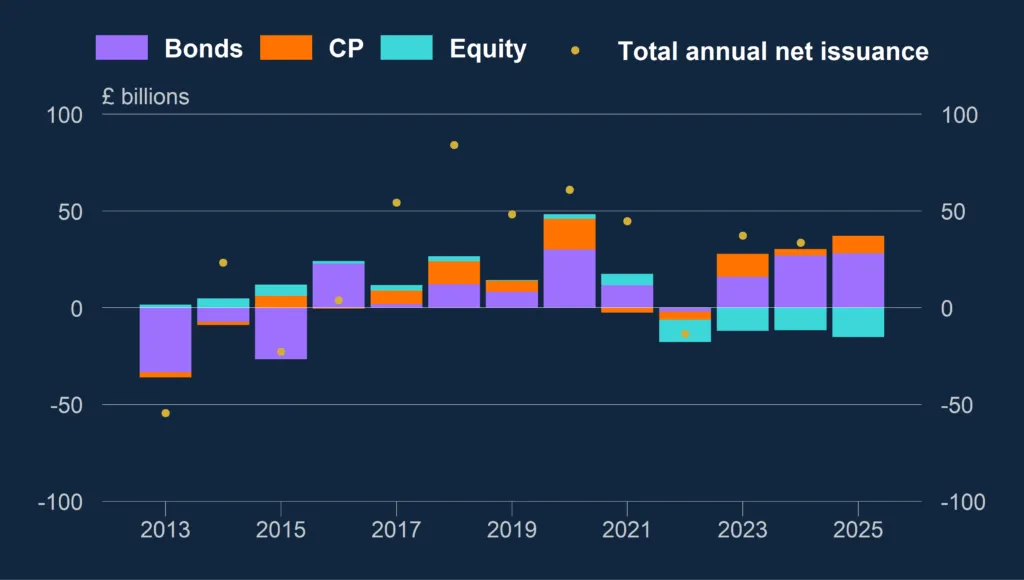
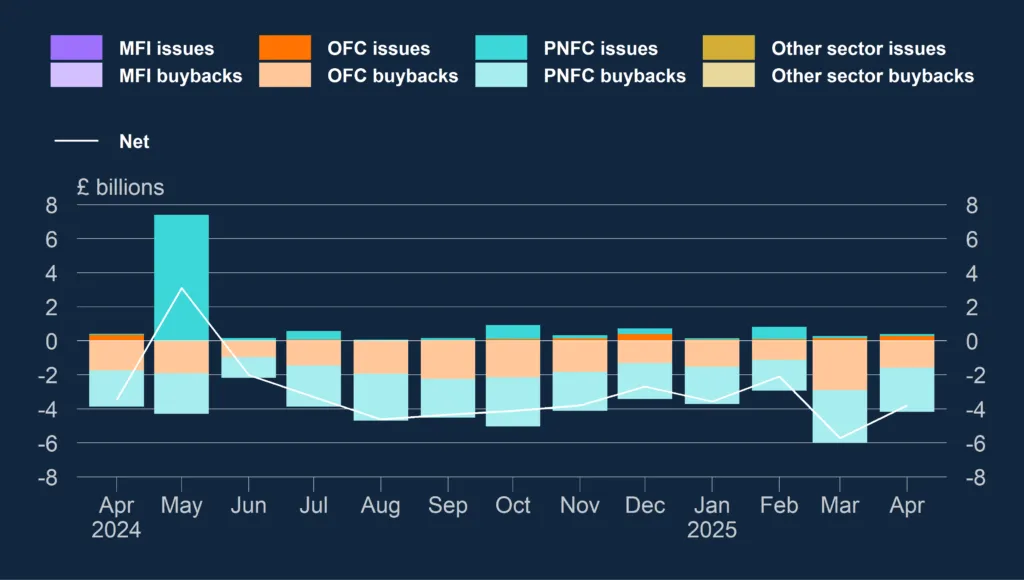
- Year to date net issuance was £21.9 billion, £3.2 billion higher than at the same point the previous year (Chart 3) and £14.0 billion higher than the previous four-year average.
Chart 1: Total capital issuance by UK residents (all currencies)
Non seasonally adjusted
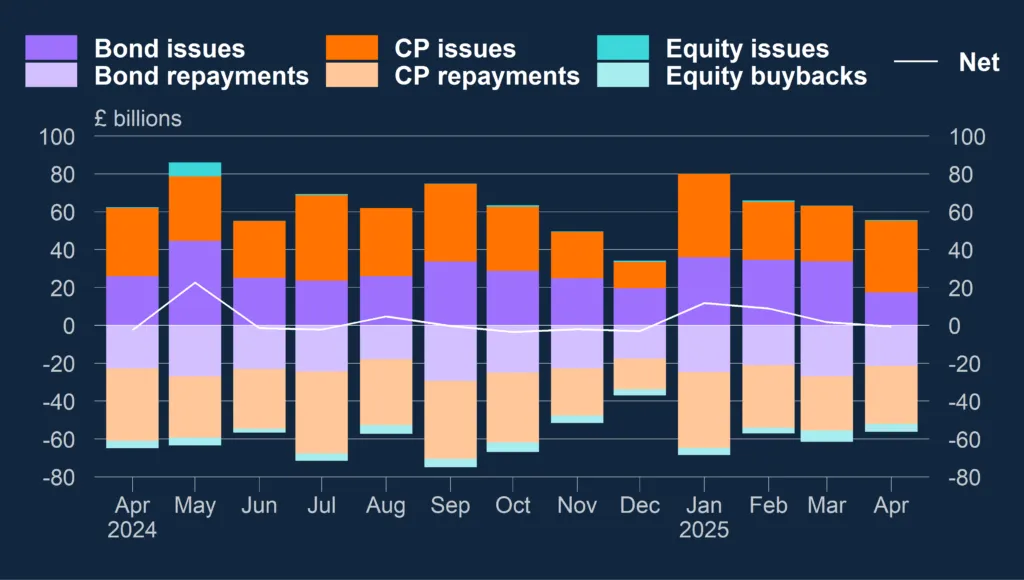
Chart 2: Gross year to date capital issuance by UK residents (all currencies)
Non seasonally adjusted
Advertisement
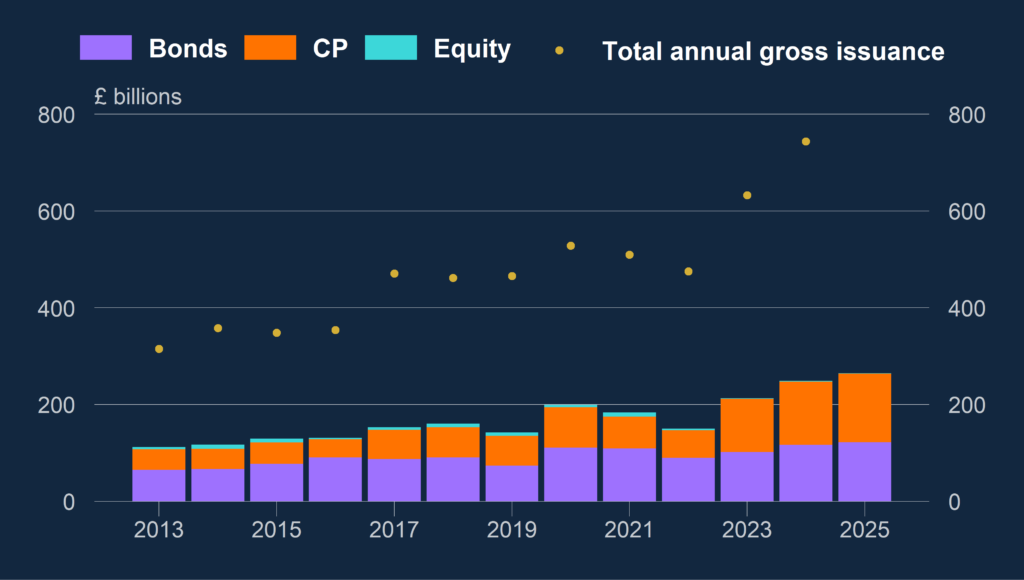
Chart 3: Net year to date capital issuance by UK residents (all currencies)
Non seasonally adjusted
Bond issuance
- Gross bond issuance was £17.5 billion in April, compared to £33.8 billion in March and the previous six-month average of £29.6 billion (Chart 4).
- Net bond issuance was -£3.9 billion in April, compared to £7.0 billion in March and the previous six-month average of £6.6 billion (Chart 4).
- The decrease in gross issuance was driven by falls in issuance of £7.9 billion and £5.9 billion by the MFI and OFC sectors respectively.
Chart 4: Bond issuance by UK residents (all currencies)
Non seasonally adjusted
Commercial paper issuance
- Gross commercial paper issuance was £37.8 billion in April, compared to £29.1 billion in March and the previous six-month average of £29.3 billion (Chart 5).
- Net commercial paper issuance was £7.1 billion in April, compared to £0.5 billion in March and the previous six-month average of -£0.6 billion (Chart 5).
- The rise in gross issuance was driven by increases in issuance of £5.0 billion and £2.6 billion by the MFI and OFC sectors respectively.
Chart 5: Commercial paper issuance by UK residents (all currencies)
Non seasonally adjusted

Equity issuance
- Gross equity issuance was £0.4 billion in April, compared to £0.3 billion in March and the previous six-month average of £0.5 billion (Chart 6).
- Net equity issuance was -£3.8 billion in April, compared to -£5.7 billion in March and the previous six-month average of -£3.7 billion (Chart 6).
- The increase in net issuance was driven by a fall in repayments of £1.3 billion by the OFC sector.
Chart 6: Equity issuance by UK residents (all currencies)
Non seasonally adjusted
Advertisement
Advertisement